Tree Size Problem
Trees are used to represent the evolutionary relationship of species. An evolutionary tree is a edge-weighted tree with each leaf representing one species. The distance between two leaves on the tree represents the dissimilarity of these two species. An important issue in computational biology is to construct the evolutionary tree from the observed dissimilarities.
Let N = {1..n}. An n*n matrix M is a metric over N if it is symmetric, nonnegative, and M[i, j] + M[j, k] >= M[i, k] for any 1<= i, j, k <=n (i.e., triangle inequality). A metric is a tree metric if it can be realized by a tree, i.e., there exists an edge-weighted tree T such that
1. the leaf set is N;
2. the weight of each edge is nonnegative;
3. and d(T, i, j) = M[i, j] for any i, j <= N, where d(T, i, j) is the shortest path length between i and j on the tree T.
For example, the following matrix is a tree metric. The corresponding tree is given in Figure 8.
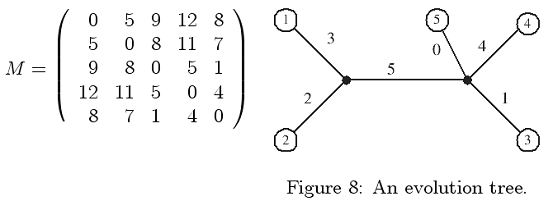
The size of a tree is defined to be the total weight of the tree edges. For a tree metric, it has been shown that the tree size is unique, i.e., it is impossible to find two trees of different sizes realizing the same tree metric. Your task is to design a program to compute the tree sizes of the given tree metrics. The following simple example may be helpful. For the case of only two species, the tree has only one edge and the tree size is just the distance between the two species. Let us consider the case of three species a, b, and c. Let T be the corresponding tree. Since T has three leaves, there is an internal node x. By definition, the path length d(T, a, b) = M[a, b]. Since x is a vertex on the path between a and b, all we need to do is to determine the weight (length) of edge (x, c). Let w(x, c) denote the weight of edge (x, c). We have
w(x, c) + w(x, a) = M[a, c],
w(x, c) + w(x, b) = M[b, c],
and w(x, a) + w(x, b) = M[a, b].
Therefore, w(x, c) = (M[a, c] +M[b, c] -M[a, b])/2.
The input file consists of several test cases. The first line of each test case is a positive integer n, 2 < n < 30. The following n - 1 lines represent the upper triangle of the tree metric, but the diagonal is not included. Each line is for one row, and elements are separated by spaces. All the elements are nonnegative integers less than 100. The last case is followed by a "0" to indicate the end of input. You may assume that the test data are all tree metrics, and it is not necessary to check them.
Furthermore, the size of a tree is the sum of all integers in the test case except the integers in the first line of the test case.
For each test case, output the tree size in one line.
5
5 9 12 8
8 11 7
5 1
4
4
15 36 60
31 55
36
0
15
71
Submit